Monitoring, Dashboards & Data Integration
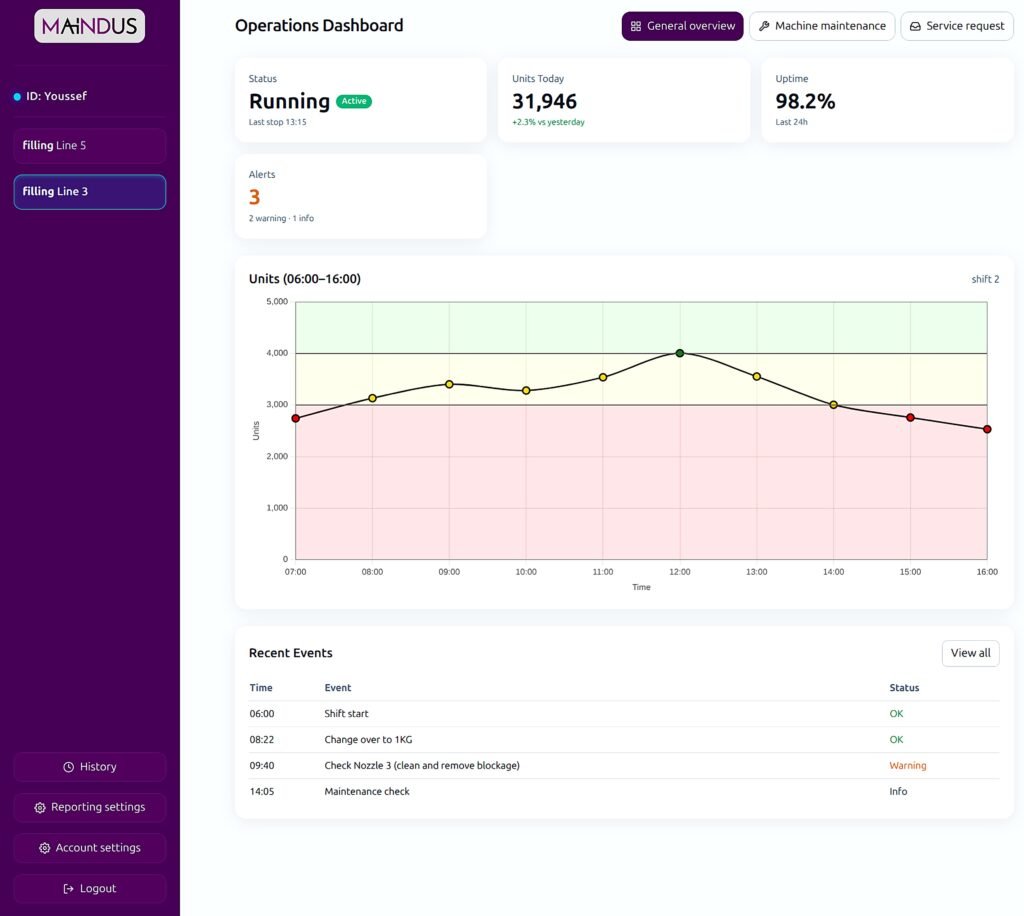
We connect your machines to dashboards, storage, and analytics — so you can monitor what matters in real time.
Whether you’re running a single line or managing a multi-site operation, our platform gives each role the insights they need: from operator alarms to executive KPIs. Local or cloud — your data, your way.
What We Monitor
From signals to insights — we help you track
- Cycle time, OEE, and availability
- Downtime (planned vs. unplanned)
- Alarms and faults
- Batch history and lot traceability
- Operator actions and production logs
✨ Built for: Fillers, cappers, mixers, basketmills, vision machines, and more.
Dashboards That Fit Your Role
Tailored views for every team:
Operators – real-time machine status, alarms, SOP access
Supervisors – line KPIs, downtime reasons, shift performance
Managers – multi-line or multi-site KPIs, OEE, trend reports
💡 Each dashboard is clean, responsive, and can be deployed locally or online.
Local or Cloud Deployment
We deploy dashboards and data pipelines the way you need them:
On the machine (HMI or IPC)
On-premises server (factory LAN)
Secure cloud dashboard (web-based, role access, encrypted)
🔒 All data handled with SSL/TLS encryption
🔐 Role-based access, audit trails, and multi-user controls
Data Integration Options
We speak the same language your systems do.
Protocols supported:
OPC UA
MQTT
REST APIs
CSV/SQL export
ERP/MES bridge modules
⚙️ We connect with existing SCADA, historians, or business systems.
Ready to Automate Your Factory?
Request a custom quote or speak with an engineer today.
